
Evaluation of efficacy and safety of Liv.52 DS tablets in acute viral hepatitis:
A prospective, double-blind, randomized, placebo-controlled,
phase III clinical trial
Dr. Rajiv Baijal, M.D., D.N.B.1, Dr. Nikhil Patel, M.D.,2 and Dr. S. A. Kolhapure, M.D.3*
1Gastroenterologist, 2Research Associates, Department of Gastroenterology,
Jagjivanram Western Railway Hospital, Mumbai Central, Mumbai, India. 3Senior Medical Advisor, R&D Center, The Himalaya Drug Company, Bangalore, India
Liv.52 DS tablets in acute viral hepatitis
Study procedure
At the initial visit, informed written consent was obtained from all the enrolled patients, after explaining to them the nature of the study; after which randomization and double blinding was done. A person unconnected with the study did randomization by using computer generated random number allocation and each arm of the study had 25 patients. Due to double blinding procedure, neither the patient nor the investigators were aware of the drug identity and therefore were unable to predict the treatment allocation. The drug identity codes were kept in sealed envelopes at a secure location to ensure the double blinding of treatment allocation.
A detailed medical history was obtained from all enrolled patients, which was followed by thorough clinical examination. All patients were subjected to hematological and biochemical investigations, which included CBC (Hb, TLC, DLC, PC), LFTs (SGOT, SGPT, SB, SA, SG, TP), ESR and tests for viral markers (IgM antiHAV, IgM antiHBc, HBsAg, IgM antiHEV).
Study drugs
The daily dose of 2 tablets of Liv.52 DS has been shown to be potentially effective and safe in the management of acute viral hepatitis and was considered adequate for this study. The drug group received Liv.52 DS and the other group received placebo. Both groups were advised to consume the drugs in doses of 2 tablets two times-a-day, orally, for 4 months. Patients were not allowed to take any other medication, which would have any significant effect on LFT.
Follow-up and monitoring
All patients were followed up every month for a period of 4 months. At each follow-up visit (1st, 2nd, 3rd and 4th month), the investigator recorded any information about adverse events (either reported or observed), and symptomatic evaluation ws conducted, which was followed by thorough clinical examination. The subjective symptomatic improvement (jaundice, anorexia, nausea, vomiting, fever and pruritus) was assessed on a predefined 0 to 3 score scale (0=poor, 1=average, 2=good, 3=excellent). At the end of 4 months, changes in the hematological and biochemical parameters from baseline values to the values at the end of the study, the duration of recovery (symptomatic, hematological, biochemical and clinical), incidence of adverse events (either reported or observed) and patient compliance to the drug treatment were recorded.
Adverse events
All adverse events either reported or observed by patients were recorded with information about severity, duration and action taken regarding the study drug. Relation of adverse events to the study medication was predefined as “Unrelated” (a reaction that does not follow a reasonable temporal sequence from the time of administration of the drug), “Possible” (follows a known response pattern to the suspected drug, but could have been produced by the patient’s clinical state or other modes of therapy administered to the patient), and “Probable” (follows a known response pattern to the suspected drug that could not be reasonably explained by the known characteristics of the patient’s clinical state).
For patients recorded as withdrawing from the study, efforts were made to ascertain the reason for dropout. Non-compliance (defined as failure to take less than 80% of the medication) was not regarded as treatment failure, and reasons for non-compliance were recorded.

Primary and secondary endpoints
The predefined primary efficacy endpoints were rapid symptomatic improvement, renormalization of hematological and biochemical parameters, and total duration of clinical recovery. The predefined secondary safety endpoints were incidence of adverse events (either reported or observed) during the study period and overall compliance to the drug treatment.
Statistical analysis Statistical analysis was done according to intention-to-treat principles. “Repeated Measures ANOVA Test” and “Bonferroni’s Multiple Comparison Test” analyzed the mean score for monthly symptomatic improvement. Changes in various parameters from baseline values and values at the end of the study were pooled and analyzed cumulatively by “Paired ‘t’ Test”. The minimum level of significance was fixed at 99% confidence limit and a 2-sided p value of < 0.001 was considered significant.
RESULTS
A total of 50 patients were enrolled in this trial and there was male preponderance in the study population (38 males and 12 females). The demographic profile, clinical profile, hematological and biochemical profile were similar in the Liv.52 DS and placebo groups and the patients were equally distributed in both the study arms.
The mean age of the enrolled patients was 33.42 years (minimum=12, maximum=63, SD=13.76, SEM=1.95, Lower 99% CI of M=28.19 and Upper 99% CI of M=38.65). The common symptoms reported by patients were jaundice (100%), anorexia (80%), nausea (74%), vomiting (40%), fever (28%) and pruritus (2%). The common clinical findings were icterus (100%) and hepatomegaly (36%). Laboratory investigations confirmed that 74% patients were suffering from hepatitis E, 10% from hepatitis B, 8% from hepatitis A, and 8% from hepatitis non A-E.
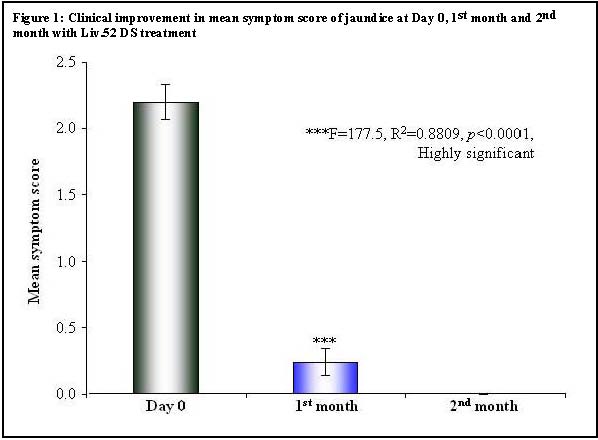
There was a highly significant (p < 0.0001) and rapid symptomatic improvement in the mean scores for loss of appetite, weight loss, fatigue and jaundice in the Liv.52 DS group, as compared to the placebo. In the Liv.52 DS group, significant (p < 0.0001) clinical improvement in loss of appetite was observed over a period of 1 month and total renormalization of appetite was evident by 2 months, while in the placebo group renormalization of appetite was seen only after 3 months (Table 1). Liv.52 DS controlled weight loss significantly (p < 0.0001) in a month and weight gain was evident in 2 months, while in the placebo group weight gain was seen only after 3 months (Table 2). There was a highly significant (p< 0.0001) improvement in fatigue in the Liv.52 DS group over a period of 1 month and complete improvement was observed by 3 months, while in the placebo group improvement was seen only after 3 months (Table 3). In the Liv.52 DS group, significant (p < 0.0001) clinical improvement in jaundice was evident by 1 month and there was complete improvement in 2 months, while in the placebo group improvement was seen only after 3 months (Table 4 and Figure 1).
At the initial visit, informed written consent was obtained from all the enrolled patients, after explaining to them the nature of the study; after which randomization and double blinding was done. A person unconnected with the study did randomization by using computer generated random number allocation and each arm of the study had 25 patients. Due to double blinding procedure, neither the patient nor the investigators were aware of the drug identity and therefore were unable to predict the treatment allocation. The drug identity codes were kept in sealed envelopes at a secure location to ensure the double blinding of treatment allocation.
A detailed medical history was obtained from all enrolled patients, which was followed by thorough clinical examination. All patients were subjected to hematological and biochemical investigations, which included CBC (Hb, TLC, DLC, PC), LFTs (SGOT, SGPT, SB, SA, SG, TP), ESR and tests for viral markers (IgM antiHAV, IgM antiHBc, HBsAg, IgM antiHEV).
Study drugs
The daily dose of 2 tablets of Liv.52 DS has been shown to be potentially effective and safe in the management of acute viral hepatitis and was considered adequate for this study. The drug group received Liv.52 DS and the other group received placebo. Both groups were advised to consume the drugs in doses of 2 tablets two times-a-day, orally, for 4 months. Patients were not allowed to take any other medication, which would have any significant effect on LFT.
Follow-up and monitoring
All patients were followed up every month for a period of 4 months. At each follow-up visit (1st, 2nd, 3rd and 4th month), the investigator recorded any information about adverse events (either reported or observed), and symptomatic evaluation ws conducted, which was followed by thorough clinical examination. The subjective symptomatic improvement (jaundice, anorexia, nausea, vomiting, fever and pruritus) was assessed on a predefined 0 to 3 score scale (0=poor, 1=average, 2=good, 3=excellent). At the end of 4 months, changes in the hematological and biochemical parameters from baseline values to the values at the end of the study, the duration of recovery (symptomatic, hematological, biochemical and clinical), incidence of adverse events (either reported or observed) and patient compliance to the drug treatment were recorded.
Adverse events
All adverse events either reported or observed by patients were recorded with information about severity, duration and action taken regarding the study drug. Relation of adverse events to the study medication was predefined as “Unrelated” (a reaction that does not follow a reasonable temporal sequence from the time of administration of the drug), “Possible” (follows a known response pattern to the suspected drug, but could have been produced by the patient’s clinical state or other modes of therapy administered to the patient), and “Probable” (follows a known response pattern to the suspected drug that could not be reasonably explained by the known characteristics of the patient’s clinical state).
For patients recorded as withdrawing from the study, efforts were made to ascertain the reason for dropout. Non-compliance (defined as failure to take less than 80% of the medication) was not regarded as treatment failure, and reasons for non-compliance were recorded.
Primary and secondary endpoints
The predefined primary efficacy endpoints were rapid symptomatic improvement, renormalization of hematological and biochemical parameters, and total duration of clinical recovery. The predefined secondary safety endpoints were incidence of adverse events (either reported or observed) during the study period and overall compliance to the drug treatment.
Statistical analysis Statistical analysis was done according to intention-to-treat principles. “Repeated Measures ANOVA Test” and “Bonferroni’s Multiple Comparison Test” analyzed the mean score for monthly symptomatic improvement. Changes in various parameters from baseline values and values at the end of the study were pooled and analyzed cumulatively by “Paired ‘t’ Test”. The minimum level of significance was fixed at 99% confidence limit and a 2-sided p value of < 0.001 was considered significant.
RESULTS
A total of 50 patients were enrolled in this trial and there was male preponderance in the study population (38 males and 12 females). The demographic profile, clinical profile, hematological and biochemical profile were similar in the Liv.52 DS and placebo groups and the patients were equally distributed in both the study arms.
The mean age of the enrolled patients was 33.42 years (minimum=12, maximum=63, SD=13.76, SEM=1.95, Lower 99% CI of M=28.19 and Upper 99% CI of M=38.65). The common symptoms reported by patients were jaundice (100%), anorexia (80%), nausea (74%), vomiting (40%), fever (28%) and pruritus (2%). The common clinical findings were icterus (100%) and hepatomegaly (36%). Laboratory investigations confirmed that 74% patients were suffering from hepatitis E, 10% from hepatitis B, 8% from hepatitis A, and 8% from hepatitis non A-E.
There was a highly significant (p < 0.0001) and rapid symptomatic improvement in the mean scores for loss of appetite, weight loss, fatigue and jaundice in the Liv.52 DS group, as compared to the placebo. In the Liv.52 DS group, significant (p < 0.0001) clinical improvement in loss of appetite was observed over a period of 1 month and total renormalization of appetite was evident by 2 months, while in the placebo group renormalization of appetite was seen only after 3 months (Table 1). Liv.52 DS controlled weight loss significantly (p < 0.0001) in a month and weight gain was evident in 2 months, while in the placebo group weight gain was seen only after 3 months (Table 2). There was a highly significant (p< 0.0001) improvement in fatigue in the Liv.52 DS group over a period of 1 month and complete improvement was observed by 3 months, while in the placebo group improvement was seen only after 3 months (Table 3). In the Liv.52 DS group, significant (p < 0.0001) clinical improvement in jaundice was evident by 1 month and there was complete improvement in 2 months, while in the placebo group improvement was seen only after 3 months (Table 4 and Figure 1).
| Table 1: Improvement in mean symptom score of loss of appetite | ||||||
| Repeated Measures ANOVA Test | ||||||
| Parameter | Day 0 | 1 st month | 2 nd month | |||
| Mean | 2.32 | 0.68 | 0.00 | |||
| Std. Deviation | 0.90 | 0.69 | 0.00 | |||
| Std. Error | 0.18 | 0.14 | 0.00 | |||
| Lower 99% CI | 1.82 | 0.29 | 0.00 | |||
| Upper 99% CI | 2.82 | 1.07 | 0.00 | |||
| Significance | ***F=109.9, R2 =0.8208, p<0.0001, Highly Significant | |||||
| Bonferroni's Multiple Comparison Test | ||||||
| Mean Diff. | t | p value | 99% CI of Diff. | |||
| Day 0 vs 1st > month | 1.64 | 12.09 | p < 0.001 | 1.219 to 2.06 | ||
| 1st month vs 2ndmonth | 1.28 | 8.01 | p < 0.001 | 0.258 to 1.101 | ||
| Table 2: Improvement in mean symptom score of weight loss | |||||
| Repeated Measures ANOVA Test | |||||
| Parameter | Day 0 | 1 st month | 2 nd month > | ||
| Mean | 0.56 | 0.04 | 0.00 | ||
| Std. Deviation | 0.87 | 0.20 | 0.00 | ||
| Std. Error | 0.17 | 0.04 | 0.00 | ||
| Lower 99% CI | 0.07 | -0.07 | 0.00 | ||
| Upper 99% CI | 1.05 | 0.15 | 0.00 | ||
| Significance | ***F=110.19, R2=0.298, p<0.0001, Highly significant | ||||
| Bonferroni's Multiple Comparison Test | |||||
| Mean Diff. | t | p value | 99% CI of Diff. | ||
| Day 0 vs 1st month | 0.52 | 4.76 | P <0.001 | 0.180 to 0.859 | |
| 1st month vs 2nd month | 0.04 | 0.36 | p >0.05 | -0.299 to 0.379 | |
| 2 nd month vs 3 rd month | 0 | 0 | p >0.05 | -0.339 to 0.339 | |
| Table 3: Improvement in mean symptom score of fatigue | |||||||
| Repeated Measures ANOVA Test | |||||||
| Parameter | Day 0 | 1stmonth | 2nd month | 3rd month | |||
| Mean | 2.52 | 1.52 | 1.00 | 0.00 | |||
| Std. Deviation | 0.51 | 0.51 | 0.00 | 0.00 | |||
| Std. Error | 0.10 | 0.10 | 0.00 | 0.00 | |||
| Lower 99% CI | 2.24 | 1.24 | 1.00 | 0.00 | |||
| Upper 99% CI | 2.81 | 1.81 | 1.00 | 0.00 | |||
| Significance | ***F=367, R 2 =0.9386, p <0.0001, Highly significant | ||||||
| Bonferroni's Multiple Comparison Test | |||||||
| Mean Diff. | t | p value | 99% CI of Diff. | ||||
| Day 0 vs 1 st month | 1 | 12.66 | p <0.001 | 0.754 to 1.245 | |||
| 1 st month vs 2 nd month | 0.52 | 6.58 | p <0.001 | 0.274 to 0.765 | |||
| 2 nd month vs 3 rd month | 0 | 0 | p >0.05 | -0.245 to 0.245 | |||
| Table 4: Clinical Improvement in mean symptom score of jaundice | ||||||
| Repeated Measures ANOVA Test | ||||||
| Parameter | Day 0 | 1 >st month | 2nd month | |||
| Mean | 2.20 | 0.24 | 0.00 | |||
| Std. Deviation | 0.65 | 0.52 | 0.00 | |||
| Std. Error | 0.13 | 0.10 | 0.00 | |||
| Lower 99% CI | 1.84 | -0.05 | 0.00 | |||
| Upper 99% CI | 2.56 | 0.53 | 0.00 | |||
| Significance | ***F=177.5, R 2 =0.8809, p <0.0001, Highly significant | |||||
| Bonferroni's Multiple Comparison Test | ||||||
| Mean Diff. | t | p value | 99% CI of Diff. | |||
| Day 0 vs 1 st month | 1.96 | 19.18 | p <0.001 | 1.643 to 2.277 | ||
| 1 st month vs 2 nd month | 1.67 | 12.38 | p <0.001 | 0.077 to 0.553 | ||
| 2 nd month vs 3 rd month | 0.00 | 0.00 | ||||
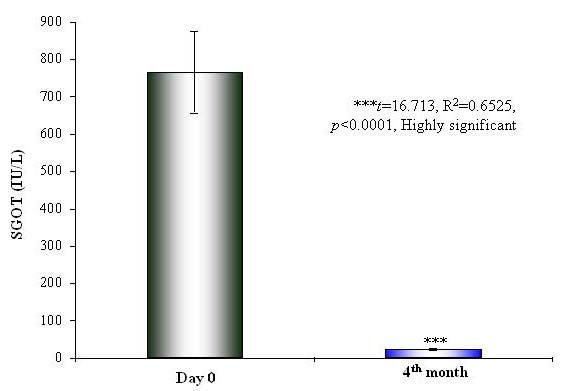
There was significant renormalization of the biochemical parameters of liver functions after 2 months in the Liv.52 DS group and after 3 months in the placebo group. There was a highly significant (p < 0.0001) reduction in the levels of SGOT (p < 0.0001) (Table 5 and Figure 2), SGPT (p < 0.0001) (Table 6 and Figure 3) and SB (p=0.0008) (Table 7 and Figure 4) in the Liv.52 DS group. There was highly significant improvement in the blood proteins, and the levels of SA (p < 0.0001) (Table 8), SG (p=0.0083) (Table 9) and TP (Table 10) were renormalized. The elevated levels of ESR (p=0.002) (Table 11 and Figure 5) and WBC (p=0.0412) (Table 12) were significantly reduced in the Liv.52 DS group, as compared to the placebo group, at the end of the study. There were no clinically significant changes in other biochemical parameters as Hb levels (Table 13) and PC (Table 14).
|
There were no clinically significant adverse effects, either observed or reported; during the entire study period, and the overall compliance to the drug treatment was found to be excellent. DISCUSSION Hepatitis A is an acute, but benign form of viral hepatitis caused by an RNA virus and the virus does not persist in the blood serum. Hepatitis A virus (HAV) is an enterovirus group of the picornaviridae family and HAV has a single molecule of RNA surrounded by a small (27 nm diameter) protein capsid. Hepatitis A is a food/waterborne disease, with feco-oral transmission. The incubation period is variable (from 15 to 25 days) and is inversely proportional to infective dose (presumably 10-100 virus particles). |
|||||||||||||||||||||||||||||||||||||||||||||
Figure 2: Improvement in SGOT levels at Day 0 and 4th month with Liv.52 DS treatment
Hepatitis A is usually a mild illness characterized by sudden onset of fever, malaise, nausea, anorexia and abdominal discomfort, followed in several days by jaundice. The dark urine (which precedes jaundice by 2/3 days) indicates the onset of the disease. The risk of transmission is generally low amongst household contacts, but outbreaks occur in nurseries and institutions with attack rates around 10%-15%. The duration of viral shedding is upto 14 days; with a sharp fall off after 5 days, but the period of infectiousness is about 8 to 17 days (the stool remains infectious upto 15 days). Asymptomatic infections are frequent. The serial interval between index and secondary cases is either shorter or equal to incubation period, indicating that transmission usually occurs before or around onset of jaundice.1
Copyrights © 2009 healthyliver.co.uk